Here is my concerne:
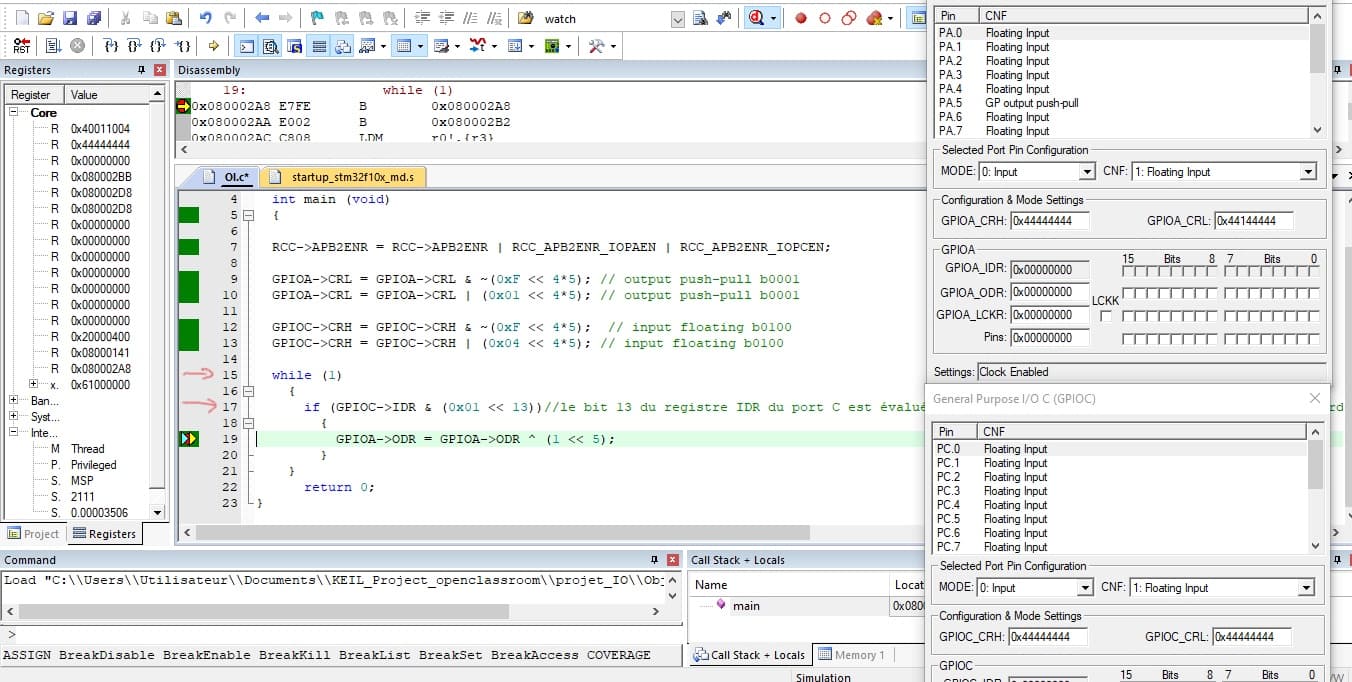
In a debug mode I want to make a stop on the Line of the while loop so that I Can easly see what happens inside my loop. But it is possible to put a stop on that Line and I want to know why.
Please let me know if you have understood.
Thanks!!!
I am making my best effort in order to be well underatood. I do not live an English speaking country and each day while Reading English datasheets I acquire proper words to explain well.
I often write in English from the technical knowledge that I have in french. That’s why it Can seem tricky to understand.
I apologize from my technical English. I will try to explained well.
Okay I will check your links. Thanks! You may have noticed that in the screen sent, I can’t use a breakpoint at the line at my “while” loop. the debug mode doesn’t allow me to make a breakpoint and it’s difficult to me to focus my attention on the body of my “while” loop.
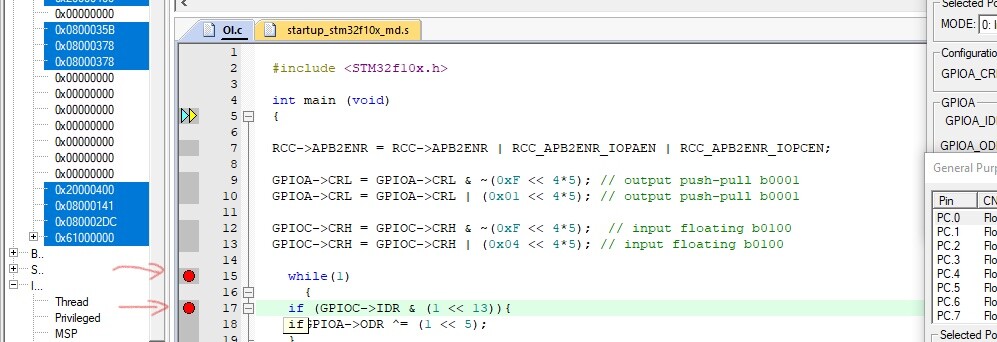
Sorry for the late reply. What option do you get when you right-click on the number? Do you get any option to add breakpoint when you right-click on the numbers 15 & 17?
Yes I can insert a breakpoint before getting to the debug mode (As a matter of fact the possibility to insert breakpoint disappear at those line in the debug mode)
Your problem with the debugger is quite similar to the one listed in the below link. Try the recommended solution in the link. I think the issue is due to the high optimisation level in the compiler. Go through the link, you will get it.